
Post provided by Juliana Pereira, Santiago Saura and Ferenc Jordán

One of the main causes behind biodiversity loss is the reduction and fragmentation of natural habitats. The conversion of natural areas into agricultural, urban or other human-modified landscapes often leaves wild species confined to small and isolated areas of habitat, which can only support small local populations. The problem with small, isolated populations is that they are highly vulnerable to extinction caused by chance events (such as an epidemic or a natural disaster in the area), or by genetic erosion (dramatic loss of genetic diversity that weakens species and takes away their ability to adapt to new conditions).
On top of that, we now have the added concern of climate change, which is altering environmental conditions and shifting habitats to different latitudes and altitudes. To survive in the face of these changes, many species need to modify their geographical distribution and reach new areas with suitable conditions. The combination of mobility (a biological property of species) and the possibility of spatial movement (a physical property of the landscape) is critically important for this.
Habitat Connectivity and Nature Reserves
Establishing systems of protected areas is an excellent way to respond to these challenges. One of the important aspects that needs to be taken into consideration in the design of nature reserves is habitat connectivity. Systems of protected areas should be planned in a way that facilitates the movement of organisms (animals, seeds) between habitat patches. This is important because it reduces isolation, increases the chances of persistence of local populations and maintains a level of accessibility that allows species to shift their ranges when necessary.
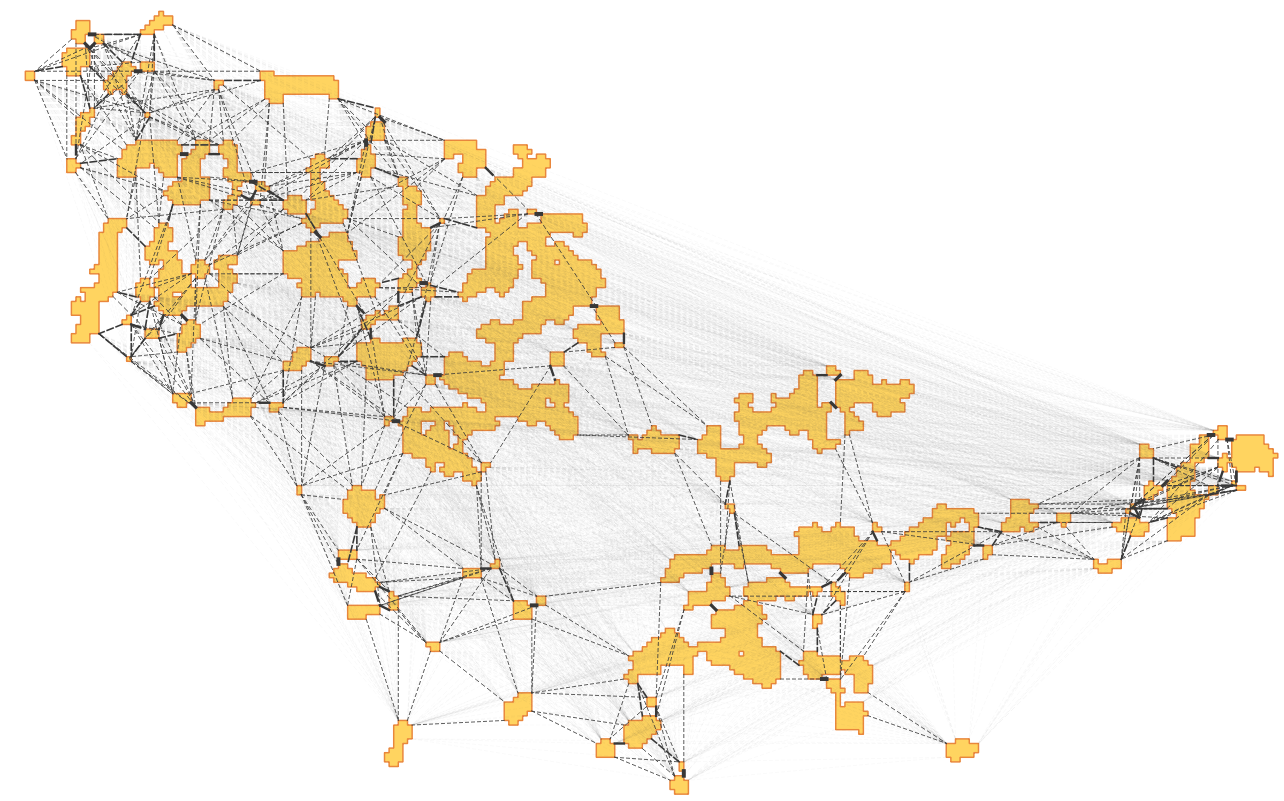
Because the resources for conservation action are limited, we’re rarely able to protect all the areas we would like to, so we need to be able to prioritise. Network analysis is a useful mathematical tool that can help us to study habitat connectivity and identify the most important patches to protect, in order to maintain connectivity. In network analysis, landscapes are represented as habitat networks, composed of nodes (representing habitat patches) and links (representing the possibility of an organism to move from one patch to another, as a function, for example, of the distance between them).
Multi-Node Network Analysis: Team Connectivity
Different network analytical indices can then be used to identify which are the most important habitat patches to protect. The Probability of Connectivity (PC) is a very robust index, that takes into consideration both the area and the location of the habitat patches (Saura & Pascual-Hortal, 2007). PC can be used in different ways, but the most common application of this index is ranking the habitat patches one by one in order of importance for connectivity.
Although the individual ranking of patches is valuable, another interesting approach is to find the best group of patches to maintain the connectivity of the network: the patches that best complement each other, so that they form the best “team” of patches for the job of sustaining the connectivity. And the best team is not necessarily composed of the highest-importance individual nodes! Like in soccer (or basketball), you won’t make a wining team by putting together the most celebrated and well-paid players, who are usually all forwards. This approach is called multi-node network analysis, and can be applied to many network indices. Multi-node network analysis is currently available through the R package keyplayer (Borgatti 2006; An & Liu 2016).
How Can We Use This to Help Vulture Conservation?

Habitat structure and connectivity is especially important for birds like vultures that are quite selective in habitat preferences. For this reason, we evaluated the habitat connectivity of two species of vultures in Catalonia, Spain: the near-threatened bearded vulture (Gypaetus barbatus) and the endangered Egyptian vulture (Neophron percnopterus), using data from the Catalan Breeding Bird Atlas. The bearded and the Egyptian vulture live primarily in mountainous areas where they nest in cliffs. In Catalonia, they are concentrated in the Pyrenees and Pre-Pyrenees, which harbour the largest European populations of both species.
Using a combination of individual ranking with the PC index and two types of multi-node analysis, we identified the most important patches for connectivity for these species, and compared them to the current Natura 2000 sites in the region.
The most important habitat areas for connectivity cover 1028.1 km² for the bearded vulture and 805.5 km² for the Egyptian vulture, of which 62.5% and 38.7% are currently included in Natura 2000 sites, respectively. Together, the priority areas for both species in Catalonia cover 1570.4 km², of which 51.5% are included in Natura 2000. This is a significant level of protection particularly for the bearded vulture, well above the 30% of land covered by the Natura 2000 network in Catalonia.
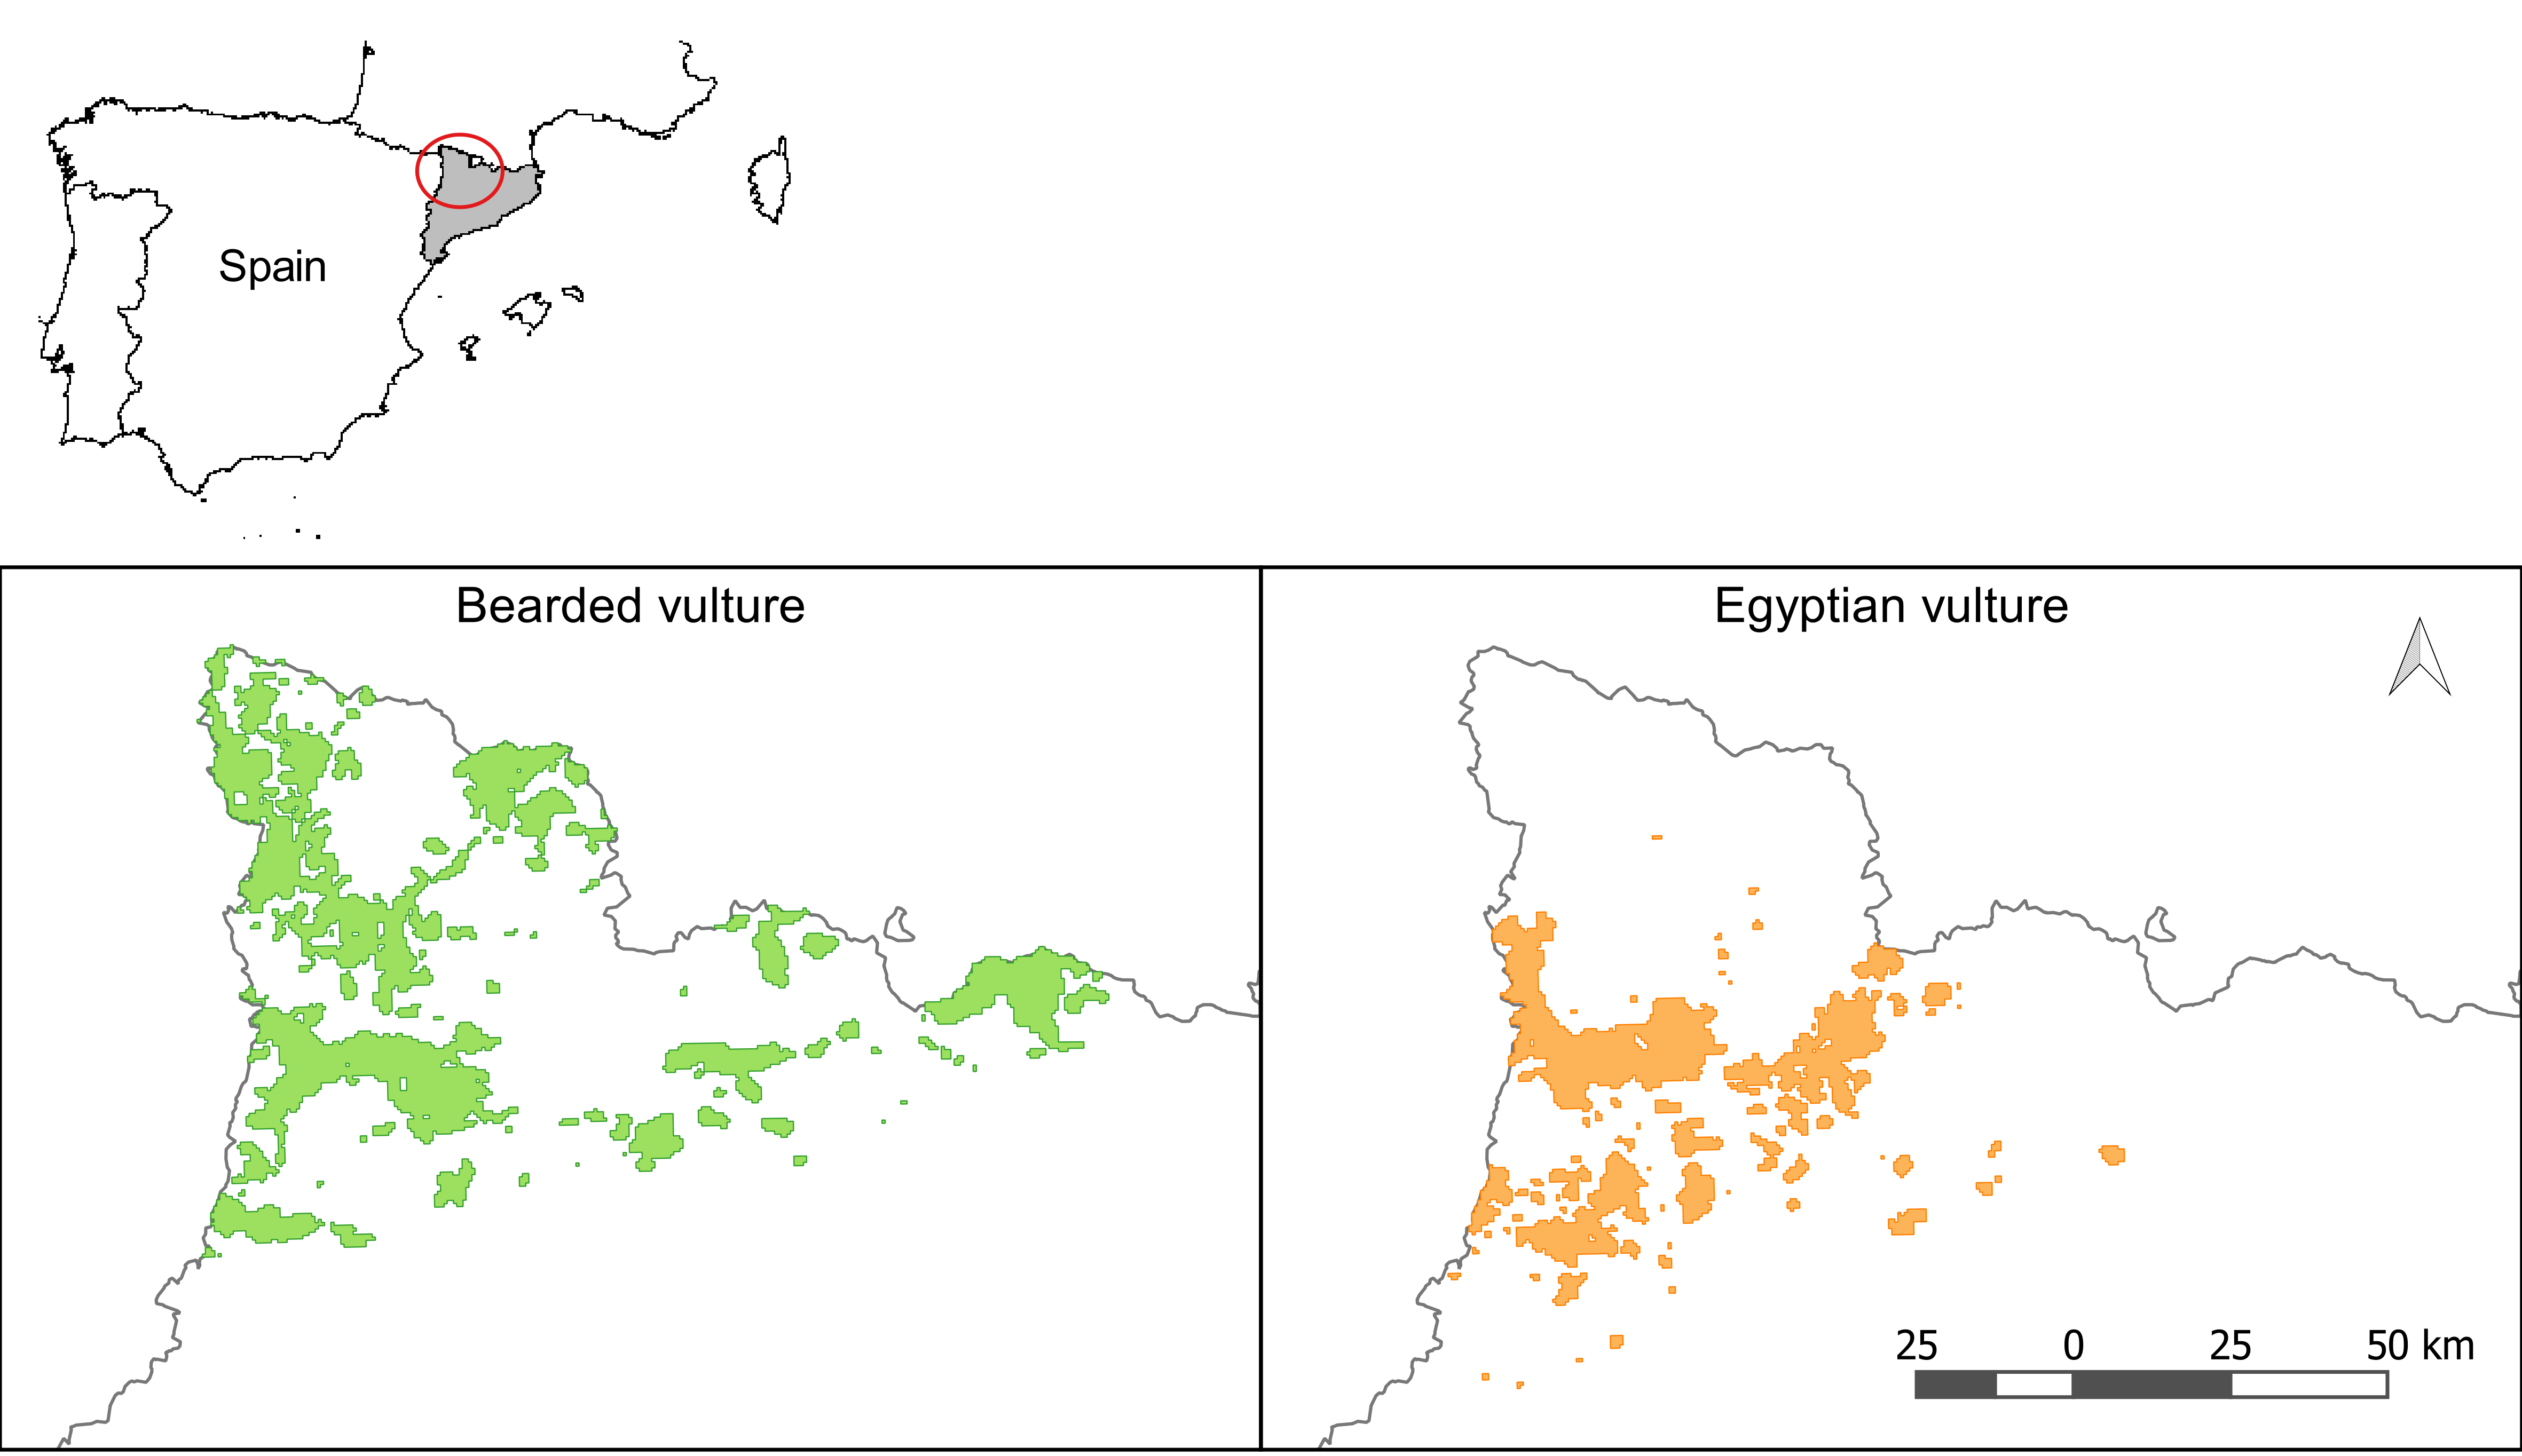
Additional improvements to the Natura 2000 network for protecting the habitat connectivity of these species may be possible, particularly for the Egyptian vulture, which is more endangered and has its key patches for connectivity comparatively less well covered by Natura 2000 sites. Protecting all of the key connectivity habitat patches we identified would require an additional area of 761.6 km². Since these populations are, together with other Spanish ones, the main populations of these two species in Europe, protecting this area would significantly contribute to the conservation of both species on an international level.

In general, network analysis is a very flexible tool for the prioritisation of habitat areas for protection. It can be easily performed with information that is already available on vulture species, as well as on other species of conservation concern. Habitat patches for input as network nodes can be taken from maps of species distributions or suitable habitats, and network links can be modelled from median dispersal distances reported for the species. It’s also possible to enhance the analysis by including additional information, like habitat quality, least-cost path modelling or data on movement of individuals (where available).
Although it’s always best to complement this approach with more detailed, closer examination of the local context of each species, the framework we propose in ‘Single-node vs. multi-node centrality in landscape graph analysis: key habitat patches and their protection for 20 bird species in NE Spain’ provides useful information for managers. It could be used as a preliminary assessment when there is a demand for urgent action or before a more detailed analysis can be conducted.
Limitations of Multi-Node Analysis and the Next Steps for the Method
The selection of priority areas with multi-node analysis is potentially more efficient and reliable in the long term than selection based on individual ranking. But, multi-node analysis as implemented in keyplayer has a limitation at present: it only accounts for the location of the patches, not for their area. Accounting for area is relevant because larger patches can contain larger populations – sometimes larger than several small patches put together (even if well connected to each other) – so larger patches should receive more weight than small patches in the analysis. One of our future projects is to implement the more complete PC index in multi-node analysis within keyplayer, combining the best of both approaches and enhacing the applied conservation insights that they can provide.
To find out more about multi-node analysis read our Methods in Ecology and Evolution article ‘Single-node vs. multi-node centrality in landscape graph analysis: key habitat patches and their protection for 20 bird species in NE Spain’.
